Example of use of tofsim
Start the session
Import the package, or simply the object ToF For instance, either:
import tofsim
T = tofsim.ToF()
or
from tofsim import ToF
T = ToF()
The object ToF keeps the information on all the construction and operation parameters
print ('Parámetros del TOF')
print (T.tof_parameters)
print ('Valor original: Vs =', T.Vs)
T.Vs = T.Vs /2.
print ('Valor cambiado: Vs =', T.Vs)
for k in T.tof_parameters:
  print ('{0} = {1}'.format(k, T.__dict__[k]))
Parámetros del TOF
['s', 'd', 'D', 'Vs', 'Vd', 'ds', 'dt', 't0', 'r0']
Valor original: Vs = 200.0
Valor cambiado: Vs = 100.0
s = 0.59
d = 1.3
D = 100.0
Vs = 100.0
Vd = 2000.0
ds = 0.03
dt = 0.008
t0 = 0.0
r0 = 1000.0
Calculations
We add some substances, for simulation of time-of-fligth signals
T.add_substances('Li,H2O')
# Veamos que fragmentos hemos agregado:
print(T.fragments.to_text())
╒═════════════╤══════════════╤══════════╤══════════════╕
│ Sustancia   │ Fórmula      │     Masa │   Abundancia │
╞═════════════╪══════════════╪══════════╪══════════════╡
│ Li          │ 6Li^{0+}     │  6.01512 │     7.59     │
├─────────────┼──────────────┼──────────┼──────────────┤
│ Li          │ 7Li^{0+}     │  7.016   │    92.41     │
├─────────────┼──────────────┼──────────┼──────────────┤
│ H2O         │ 1H2-16O^{0+} │ 18.0106  │    99.7341   │
├─────────────┼──────────────┼──────────┼──────────────┤
│ H2O         │ 1H2-18O^{0+} │ 20.0148  │     0.204953 │
╘═════════════╧══════════════╧══════════╧══════════════╛
The method ToF.signal() returns the simulated signal of the TOF.
s = T.signal()
print ('type(s):', type(s),'\n')
print ('keys:', s.keys())
type(s): <class 'dict'>

keys: dict_keys(['signal', '6Li^{0+}', '7Li^{0+}', '1H2-16O^{0+}', '1H2-18O^{0+}', 'time'])
The result is a dictionary, where each element is a data array:
s[‘time’] the x-axis, contains the time-window
s[‘signal’] has the resultant signal, summing the individual signal for all the species.
All other elements, of the form
s[substance]have the values of the signal for each substance.
# Cada elemento es un numpy array
print (type(s['signal']))
<class 'numpy.ndarray'>
Note that it is not necessary to keep the value of s in the above example, it is kept in the ToF object as T.times
T.times == s
True
Plotting
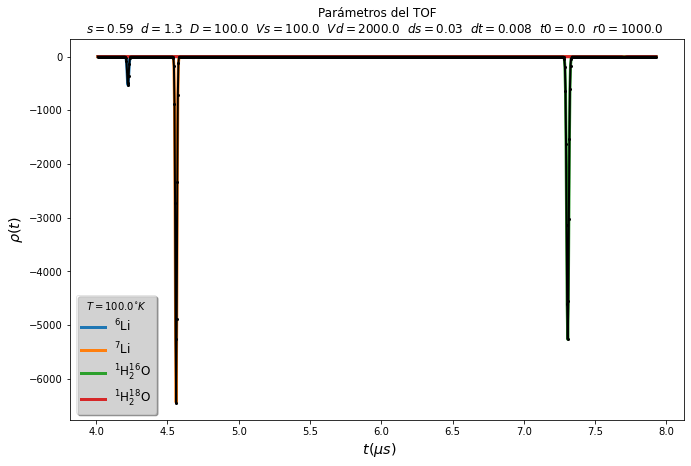
The simplest way of plotting the signals is using the method make_plot.
f = T.make_plot(T.fragments, negative=True, graph_all=True, hide_legend=False)
This method allows for some customization. Also, since the data is kept in numpy arrays it may be plotted independently:
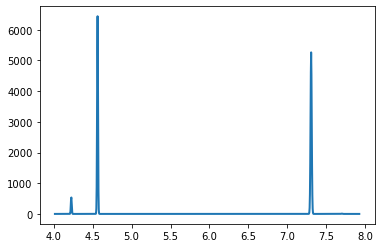
import matplotlib.pyplot as plt
x, y = T.times['time'], T.times['signal']
plt.plot(x, y)
[<matplotlib.lines.Line2D at 0x7fe9faa94ee0>]